— by
K. Fisher fisherka@ipns.comIntroduction
This dashboard is targeted to intermediate and advanced amateur aurora chasers. Persons new to this topic are urged to watch Vincent Ledvina's, Phd, ("The Aurora Guy") instructional videoes on the basics of solar physics for aurora chasing and determining when the aurora will be out. Curated urls to support intermediate and advanced aurora chasers follow. For expert amateur chasers, a index to Dr. Skov's 2024-2025 lectures that review recent new aurora chase related websites is available. For intermediate and expert chasers, this author has also prepared an estimate of remaining events KP > 6 and KP > 7 in Cycle 25. As of January 2025, that crude estimate is, globally, ≈ 150 events KP > (6,7\] and ≈ 50 events KP > (7,8\]. These global estimates are not adjusted for local circumstances. Expected lcoal events are much lower, allowing for weather, daylight and the likelihood of a solar event occuring over a specific geographical location.
Fall Season Observing Note
With the arrival of the autumnal equinox on September 22, 2025, Canadian and high-latitude web cams increasingly will begin to resume operations as night-time hours increase. During the summer, most webcams north of and at Banff, Canada no longer have sufficient night-time hours for aurora observing to justify operations. Although the Univ. of Alaska Poker Flats station has no astronomical twilight darkness until fall, it does run under nautical twilight conditions for a few hours starting at 11:30 am AKDT, or 1:30 am MDT. Intense aurora may be seen on the Poker Flats webcam during nautical twilight observing conditions.
Installing Updates to this Website
To have updated changes to this website display, it may be necessary to occasionally delete your browser history references to this website with: History | Search History | "Aurora Chasing" | Delete. Many browsers will persist an outdated image of this webpage in local storage in order to reduce server-to-client internet traffic.
0. The 9pm MDT (8pm MST) Intermountain Quick Check
For observable aurora in the northern Intermountain West (Utah), generally,
- Bt on the SWPC ACE Real Time Wind chart must be greater than 10 nt;
- Bz on the SWPC ACE Real Time Wind chart must be less than 0 nt (negative);
- Gigawatts (GW) on the SWPC Ovation must be greater than 80 GW, preferably greater than 100 GW;
- The Forecast Kp Index on the SWPC Kp 3-Day Leading Forecast table for the current UTC time must be greater than or equal to 6 KP;
- At 9pm MDT (8pm MST, 3 UTC), advance web cam imagery to the East of the western observer, in particular at the Isle de Royale National Park's North Shore Webcam and Greenstone Ridge Northeast Webcam, should show some auroral activity, i.e., the southern edge of the main auroral oval is visible down to over-the-horizon glow;
- At 10 pm MDT (9pm MST, 4 UTC), advance web cam imagery to the East of the western observer at the North Dakota NoDDAC (North Dakota Dual Aurora Camera) webcam should show some auroral activity; and,
- At 11pm-12am MDT (10-11pm MST, 5-6 UTC), advance web cam imagery to the North of the Intermountain observer at Banff, Alberta, Canada webcam should show some auroral activity.
I. Plan Long-Range: Find CME Arrival Times
II. Plan for Tonight
(A) Check Short-Term Forecast Models Indicating Position of the Bright Portion of the Main Aurora Oval.
(B) Check Current Spacewind and Magnetometer Readings.
SWPC Real-Time Solar Wind - Bz and Bt Potsdam GFZ Hpo30 - 30 Minute Leading Kp ACE Low-Energy Protons - Track Wave Arrivals Potsdam GFZ Real Time Radiation Belt Forecast - 5 Minute Leading CANMOS Magnetometer Stack at SpaceweatherLive Canadian Magnetometer Observatory System Stack at Canada.ca SWPC Total Electron Count Scintillation - 20 Minute Lagging SWPC-Univ. of Michigan Ground Magnetism - 20 Minute Leading
|
|
Source: USGS. |
(C) Check the Regional Weather via Satellite Imagery.
(D) Consult Real Time Local Sightings.
III. Check Webcams
(A) UTC and Local Sidereal Time
Local Sidereal Time: USNO Bright Star Chart by RA° North Circumpolar Constellationsby RA
(B) Horizontal East-to-West Racetracks - High and Low Latitude Webcams and Local Weather
(1) High-Latitude Webcam and Local Weather Stations
Fort Churchill, Manitoba, Canada UTC 6:16 Mlat N67.4° Glon W94.1°:
Northern Lights Cam Weather for Churchill, ManitobaUniv. of Calgary, Yellowknife, NWT, Canada UTC UTC 7:37 Mlat N68.3° Glon W114.35°:
Yellowknife Cam Weather for Yellowknife, CanadaUniversity of Alaska, Fairbanks, Alaska - Poker Flats - UTC 9:50 Mlat N65.2° Glon W147.5° - Toolik Lake Mlat N68.5° Glon W149.6°:
Poker Flats and Toolik Lake Webcams Clear Sky Clock Weather for Poker Flats
(2) Mid-Latitude Webcam and Local Weather Stations Along the U.S. Canadian Border
Post Observatory, Trenton, Maine UTC 4:34 Mlat N53.4° Glon W68.4°:
Post Observatory Weather for Trenton, MaineIsle Royale National Park, Michigan Mlat UTC 5:54 N57.1°s Glon W88.5°:
Isle Royale Webcams Clear Sky Chart Thunder Bay, MichiganUniv. of Minnesota, Gunflint Trail Center, Grand Marias, MN UTC 6:10 Mlat N57.6° Glon W90.9°:
Gunflint Trail Nature Center Clear Sky Chart Grand Marias, MinnesotaUniversity of North Dakota NoDDAC, Grand Forks, N.D. UTC 6:28 Mlat N56.° Glong W97.1°:
UND Physics Webcam Clear Sky Chart Grand Forks, N.D.Banff, Alberta, Canada Mlat UTC 7:42 N57.3° Glong W115.6°:
Banff Webcam Clear Sky Chart Banff, Alberta CanadaGlacier National Park, St. Mary's UTC 7:34 Mlat N55.2° Glon W113.4°:
St. Mary's All Sky Webcam St. Mary's Visitor Center Webcam Clear Sky Chart St. Mary's Visitor CenterShunkBayWeather.com, Shunk Bay, WA UTC 8:10 Mlat N51.1° Glon W122.5°:
Shunk Bay Cam Weather for Shunk Bay(C) Vertical North-to-South Racetracks - High and Low Latitude Webcams and Local Weather Stations
Post Observatory, Trenton, Maine UTC 4:34 Mlat N53.4° Glon W68.4°:
Post Observatory Weather for Trenton, MaineFort Churchill, Manitoba, Canada UTC 6:16 Mlat N67.4° Glon W94.1°:
Northern Lights Cam Weather for Churchill, ManitobaIsle Royale National Park, Michigan Mlat UTC 5:54 N57.1°s Glon W88.5°:
Isle Royale Webcams Clear Sky Chart Thunder Bay, MichiganUniv. of Minnesota, Gunflint Trail Center, Grand Marias, MN UTC 6:10 Mlat N57.6° Glon W90.9°:
Gunflint Trail Nature Center Clear Sky Chart Grand Marias, MinnesotaUniversity of North Dakota NoDDAC, Grand Forks, N.D. UTC 6:28 Mlat N56.° Glong W97.1°:
UND Physics Webcam Clear Sky Chart Grand Forks, N.D.Univ. of Calgary, Yellowknife, NWT, Canada UTC UTC 7:37 Mlat N68.3° Glon W114.35°:
Yellowknife Cam Weather for Yellowknife, CanadaBanff, Alberta, Canada Mlat UTC 7:42 N57.3° Glong W115.6°:
Banff Webcam Clear Sky Chart Banff, Alberta CanadaGlacier National Park, St. Mary's UTC 7:34 Mlat N55.2° Glon W113.4°:
St. Mary's All Sky Webcam St. Mary's Visitor Center Webcam Clear Sky Chart St. Mary's Visitor CenterUniversity of Alaska, Fairbanks, Alaska - Poker Flats - UTC 9:50 Mlat N65.2° Glon W147.5° - Toolik Lake Mlat N68.5° Glon W149.6°:
Poker Flats and Toolik Lake Webcams Clear Sky Clock Weather for Poker Flats
ShunkBayWeather.com, Shunk Bay, WA UTC 8:10 Mlat N51.1° Glon W122.5°:
Shunk Bay Cam Weather for Shunk BayIV. Report Sightings and Review Post-Event Polar Satellite Aurora Images
V. Purpose and Background
The central nightly question for an aurora chaser is "What is the current position of the brightest portion of the main aurora oval?" That position is anti-pole to the Sun on the Earth's dark side and moves from the east to the west in geographic longitude each hour. The position of the main aurora oval also moves north-south in geographic latitude depending on the instant intensity of a solar storm.
First, if your interest is not the current night solar wind, but rather is the likely arrival time of Coronal Mass Ejections over the next few days or tonight, use the section titled "Plan Long-Range: Forecast CME Arrival Times."
Second, the position of the main auroral oval is forecasted by the Ovation Prime 2013 models of the NOAA SWPC and ISWA. See section "Forecast Position of the Bright Portion of the Main Aurora Oval" above. The Ovation Prime model only has an accuracy of about 77 percent. The forecasted position of the main aurora oval in latitude and longitude can be confirmed by several techniques.
Third, involves knowledge of how brightest portion of the main aurora oval moves throughout the night in geographic longitude. Generally, the brightest portion of the main auroral oval is along a line from the North Magnetic Pole and the UTC time offset at the observer's location. That hour angle on the dark side of the Earth is anti-pole to the Sun's position. For example, at Salt Lake City, Utah, the UTC time offset is -7:43 hours:minutes. On any given night, the brightest part of the aurora oval will be pointing at Salt Lake City at 7:43 hours:minutes UTC. Typically, in the winter during Mountain Standard Time, that occurs at 12:43 am MST each night.
Fourth, corroborate the main oval's position in latitude using the CANMOS magnetometer system. See "CANMOS Summary Plot" above. Orange highlighting in the CANMOS magnetometer summary chart indicate regions of higher magnetic disturbance using measurands of rolling nanoTesla variance.
Fifth, consult real-time sighting data including the sightings maps at Aurorasaurus.org and social media posts in groups like Facebook's "Northern Light Alerts" or Spaceweather.com's "Real-time Aurora Gallery." These sights can be used to track aurora sightings in real-time as the main aurora oval rotates over the Northeastern United States to the Intermountain West. Temporal sighting reports and real-time web cameras can greatly inform whether and the timing of a local Intermountain West aurora chase.
Sixth, consult real-time webcameras maintained by reliable governmental and academic entities and the occasional private enthusiast. That technique is the focus here.
Digital webcam aurora chasing is seasonal. After the spring equinox, the Northern Arctic have progressively longer days such that the late-night auroral arc is washed out by sunlight. Usually around May 1st, daylight is so pervasive at high-northern latitudes above 60 degrees North that high-latitude webcams are not useful for detecting the position of the main aurora oval. Many are shut down for the Arctic summer. After the autumnal equinox, night returns to the northern arctic and with it, the visible main aurora arc.
Extreme coronal mass ejections (CMEs) are not seasonal and may be visible at any time of the year during periods of high sunspot or solar wind activity.
VI. How to Use this Aurora Chasing Dashboard:
- Use the section titled "Forecast CME Arrival Times" to identify future likely arrival times of Coronal Mass ejection impacts. The HUXt and the SWPC ENLIL models, in conjunction with the SWPC Narrative Forecast is useful for identifying the expected arrival times of CME wave fronts. The HUXt and SWPC ENLIL are also useful for determining whether wavefronts will directly impact the Earth or will only be glancing blows.
- Use the Ovation Prime utilities that forecast the position of the main aurora oval to estimate the current position of the brightest portion of the main auroral oval in longitude and latitude. See section "Forecast Position of the Bright Portion of the Main Aurora Oval," above.
- Use the section titled "Real-Time Sightings" to check for the progress of the main aurora oval as it points at the eastern United States and then progresses to Midwest and then Intermountain Region.
- Use the CANMOS Magnetometer Summary Plot to estimate the position in southern-most latitude of the main aurora oval. See section "Forecast Position," above.
- Use the Potsdam Hpo30 Index to estimate changes in Kp index at 30 minutes intervals in the short-term future. Might a short-term substorm occur tonight? Use this primarily during active storms.
- Two duplicate means of searching for the bright arc in the main bright oval are provided: Horizontally along latitude lines progressing from east-west longitude, and vertically along longitude lines from north to south latitudes.
- The position of the brightest part of the arc in longitude generally points at a station at approximately its "UTC" offset time. The "UTC" time is listed for each station.
- Identify the web cameras that are closest to the brightest arc portion of the estimated position of the main auroral oval.
- Check the regional weather nearest the best aurora arc webcam station. See section "Regional Clouds," above. Are the best cameras clouded out? During the winter, they frequently are.
- Check the local weather station nearest the best aurora arc webcam station. See sections "High-Latitude Webcams" and "Mid-Latitude Webcams," above. Again, are the best webcam stations clouded out?
- Select and click the best webcam station to view the applicable webcam for the presence of the main aurora oval. The main auoral oval may be either within the camera's central field or to the south or north of the camera's position at the edge of the field-of-view. Sometimes, the aurora captured on these cameras are dramatic!
- For summer months, using camera links organized by "Race Tracks Horizontal - East to West" are more informative. For major winter high Kp events, using camera links organized by "Race Tracks Vertical - North to South" are more informative.
- The Local Sidereal Time (south horizon facing) and RA at Due North can be used in conjunction with star charts to determine what constellations should be on the northern horizon, visible in the background of foreground aurora displays. The constellations in the background, confirm that the webcam is in fact pointing north. For RA facing north, RA_north= (LST+12) (modulus 24). For RA° facing north = ((LST (hours)×15)+180) mod 360.
- Enter the "Obs. Longitude°" with a west longitude as negative number, e.g., Salt Lake City, Utah's longitude is West 111.8881, entered as -111.8881.
VII. Station or Website Specific Notes:
- Dr. Tamitha Skov: Dr. Skov does a weekly podcast forecasting space weather, generally on Mondays. Dr. Skov also releases weekday update podcasts during major aurora events. She is a highly informative expert and excellent communicator of solar science to the general public. Similar to a communication technique used by terrestrial TV news meteorologists, she wears a red colored shirt when major aurora events are underway that might be observable by mid-latitude aurora chasers.
- SWPC Solar Synoptic Map: Identifies the current Active Region (AR) numbers for sunspot groups on the near-side face of the Sun.
- SWPC GOES Solar Ultraviolet Imager (SUVI) - Thematic Map: Under the "GOES Solar Ultraviolet Imager (SUVI)," choose the Thematic Map by scrolling to the bottom of the selection grid. This thematic map distinguishes active bright regions (that are higher than the mean solar surface) from coronal hole regions (that are lower than the mean solar surface). It is easier to interpret than the daily SWPC Solar Synotic Map. Other images and movies on the SUVI page include the basic suite of solar disk movies in hydrogren alpha, calcium and high temperature iron wavelengths. The golden brown 195 angstrom image reveals the emission of 11-times ionized iron atoms (Fe XII), regions of high solar temperature, solar flares and coronal mass ejections (CMEs). The Thematic Map also succinctly identifies active prominence regions on both solar limbs.
- University of Alaska at Fairbanks Geophysical Institute: This main oval model covers tonight's next hours. The model is based on ground magnetometer station historical data. It was the primary model before Ovation Prime. Its predictions are more conservative than Ovation Prime.
- University of North Dakota Dual Aurora Camera (NoDDAC): The YouTube url of the North Dakota Physics Department webcam changes nightly. Check the timestamp on this webcam video (and for all other stations) to confirm that you are watching a current real-time video. If prior night's video is being displayed, e.g., for the North Dakota Physics Department webcam, navigate to the top of the provider's YouTube video channel and look for a "Live" video tab.
- Univ. of Minnesota, Gunflint Trail Center: The url opens to a Google Public Drive. Sort the grid display on descending date. Then open the subdirectory for the current date. Next, sort the subdirectory on descending date. The top jpg file is the most recent image.
- JPSS Polar Satellite 1 Day Lag Composite Image: On all nights for the following morning, the "JPSS Aurora - Polar 1 day lag" display is useful for retrospective review of last night's events. The JPSS polar view traces the actual position of the bright arc retrospectively for the last 7 hours. This can clarify when and why aurora were or were not visible in various cameras throughout the prior night time. The time to check the JPSS 1 day display is 14-15 UTC (8-9 am MST). The JPSS coverage is time-rolling, and the 12-14 UTC timeframe bests captures the most significant North American coverage for the prior night.
- JPSS Polar Satellite 1 Hour Lag Composite Image: During the brightest of Kp 6+ storms, the "JPSS Aurora - Polar 1 hour lag" display sometimes shows the position of the bright arc over central and southern Canada with a 1 hour lag time.
- ISWA graphs: It may be necessary to use the "Clear" button at the top right menu strip to clear the display before using this web application.
- ISWA ENLIL Forecasts / Nowcasts: The "ENLIL Forecasts Nowcasts" display cannot be loaded by direct url. Use the "Search" button the top menu strip and enter "ENLIL Forecasts / Nowcasts" to find and load the display. This display graphs solar wind velocity or density. The unique feature of this display is the graph on the right-side. It shows the x-z slice of the solar wind from an observing point from behind (anti-solar) viewpoint. This adds a key dimension for determining where relative to the Earth a CME will pass Earth's orbit. This sub-plot is particularly useful for identifying side-glancing CMEs that may miss the Earth, but that appear to hit the Earth in a top-down North Polar view graph.
- Potsdam Hp30 Forecast: Scroll down the page to find the applicable panel. This index forecasts a short-term 30 minute Kp Index to estimate changes in Kp index. The Kp Index normally updates every 3 hours. Hp30 fills in with shorter term estimates. Use this primarily during active storms to detect possible substorms.
- ACE Low-Energy Protons At the ACE Real Time Solar Wind Page, select the option for "Low Energy Protons - Electron Proton Alpha Monitor (EPAMp)." If the arrival of an initial CME wave becomes uncertain, the arrival can often be determined one or two hours in advance using the SOHO ACE proton detector. The five levels of proton energies shown in the graph will be flat. As the wave arrives, the proton levels will rise dramatically over the short term. This will occur before other magnetic indicators increase and-or the high proton levels can be used to distinguish a false magnetic wave signal from a true wave arrival.
- Potsdam GFZ Advanced Visualizations:
- Potsdam GFZ Pager Neural Net Model: This model produces optical detection indices similar to the SWPC's Ovation model using a 3D globe visualization similar to the ISWA Ovation Model. But the GFZ Pager model enhances predictions using neural net predictions.
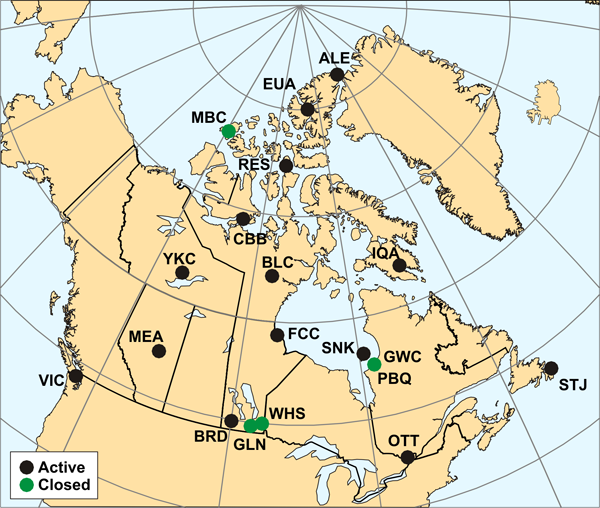
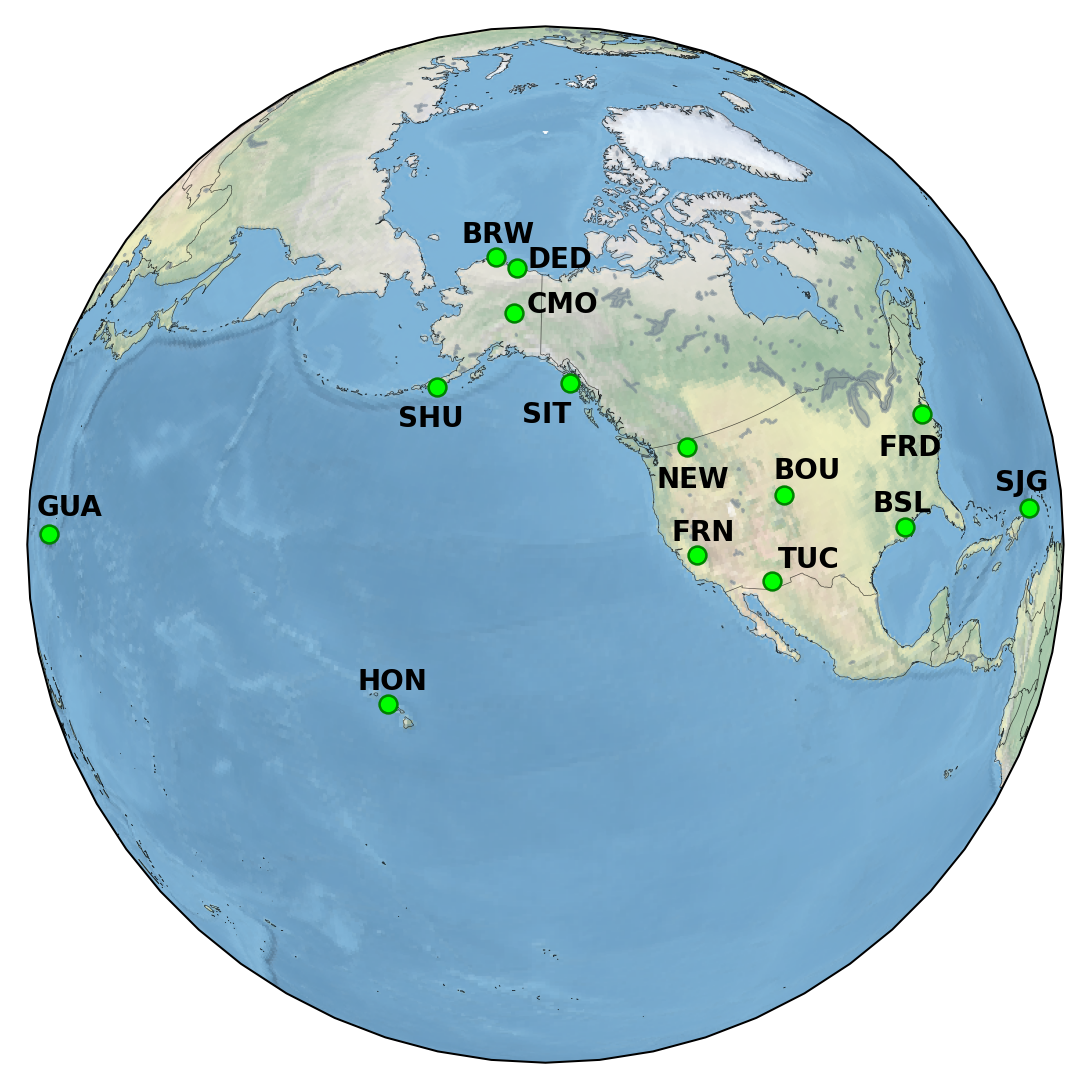
- Potsdam GFZ Dynamic Geomagnetic Model: This visualization of the global ties global forecasts like the SWPC Ovation and GJZ's Pager to specific stations in the Northern Hemisphere, including the geomagnetic stations at Ottawa and Fredericksberg and Meanook Magnetic Observatory in Athabasca, Alberta, Canada, at 51.6 N. Latitude. The Boulder and Tucson USGS magnetometers are not included. This visualization may provide an enhanced accuracy "on-off" prediction for North American aurora events that reach below the Canadian border.
- Potsdam GFZ Radiation Belt Model: This visually impressive globe model has an impressive 5 minute resolution update. Like the SWPC Geomagnetosphere Movie Models, this model has promise to provide improved real time nowcasting of substorms.
- Northern Lights Alert Facebook Group: Scan the 20 most recent entries. Examine only those images that have fully declared (1) date, (2) time, and (3) location in the header. Images in the Northern Lights Alert social media group can be used to corroborate the recent position of the bright arc in latitude. Most images in this social media group are not usable for confirmation purposes because they are not properly labeled in accordance with community rules. This is a private group and you must join the group to view the images.
- SpaceWeather.com Real Time Aurora Gallery: Scan the 20 most recent entries. Examine only those images that have fully declared (1) date, (2) time, and (3) location in the header. Images on this commercial site can be used to corroborate the recent position of the bright arc in latitude. Most images in this social media group are not useable due to time lags in posting and-or failure to properly label images for the date-time and location of the exposure.
- Glendale App: A few social media aurora tracking sites have (1) a real-time amateur observer sighting reporting map and (2) a sufficient participation rate to provide meaningful data. Glendale app is one of these. Others are the Aurorasaurus.org and the "Aurora" app. On the Glendale app website, scroll down to the "Live Reports" chart, and click on the "Canada" tab. The Glendale app map is low resolution.
- My Aurora Forecasts and Alerts: The free 'My Aurora Forecasts and Alerts' app must be installed from the Google Android or Apple IOS Stores. The developer does not provide a web-only interface. The application contains a real-time sightings map and with a 1 million download base, enough CONUS reports are made so the sightings map contains meaningful temporal information. The 'My Aurora Forecasts' map roughly corresponds to the academic Aurorasaurus.org map, but has a much larger user base. The Glendale app online website also has a much larger user base to support its sightings map as compared to Aurorasaurus.org. Read together, the three sites give a useful temporal map of the main oval as it moves north of the East U.S. Coast to the West U.S. Coast. The popular 'Space Weather Live" application and website do not include a real time sightings map.
- SWPC Total Electron Count Scintillation: This display detects scintillation in upper atmospheric layers by using nanometer changes in signals received from GPS satellites taken as a low angle. The upper atmosphere scintillates during aurora substorms.
- SWPC Ground Magnetism: This ground magnetism model generates a 2-D Canadian-CONUS map of near real-time subsurface magnetic readings. This display is primarily used by power stations, but anomaly changes can indicate real time substorms.
- SWPC and Univ. of Michigan Magnetosphere Field Movie: This model, in addition to being visually stunning, has a 20 minute lead time and may indicate substorms.
- Fort Churchill, Manitoba, Canada webcam: Often this webcam looks to the East and not to the North.
- U.S. Naval Observatory Bright Star Chart: This chart is used in conjuction with the Local Sideral Time and the RA at North to ascertain what north horizon constellations should be visible in a north pointing webcam.
VIII. Acknowledgements:
- AllSkycam.com (Hosting Post Observatory Webcam).
- AuroraMax, University of Calgary. (Yellowknife Webcam).
- Aurorasaurus.org, Department of Physics and Astronomy, University of North Dakota, Grand Rapids, North Dakota. (Real-time sight reports, Canada and United States).
- Banff Sunshine Village, Banff, Alberta, Canada. (Banff Webcam).
- Canada Natural Resources, Geophysical Office.
- Chik-Wauk Museum and Nature Center, Gunflint Trail, Grand Marais, Minnesota. (Gunflint Webcam).
- Community Coordinated Modeling Center, Goddard Spaceflight Center, National Atmospheric and Space Administration.
- Cooperative Institute for Research in the Atmosphere, Colorado State University. (JPSS RAMMB Slider.
- Danko, Attilla. Clear Sky Clock.
- Explore Anneberg, LLC. Explore.org. (Churchhill Webcam).
- Geophysical Institute, University of Alaska at Fairbanks. (Poker Flats and Toolik Lake Webcams).
- GFZ Helmholtz Centre for GOESciences, Section Geomagnetism with Geomagnetic. (Hpo 30 Index).
- Glacier National Park Conservancy. (Webcam hosting).
- Glendale App - Aurora Alerts. (Real-time sightings map for Canada-US).
- Greenland Airports, Mittarfeqarfiit. (Webcam hosting).
- Icelandic Met Office, Government of Iceland.
- Integrated Space Weather Analysis. (Aurora oval modelling).
- J Ruston Apps, B.V. (My Aurora Forecast and Alerts).
- Jiménez, Victor and Salvador Rubio, Univ. of Barcelona (Local Sidereal Time code).
- Marshall W. Alworth Planetarium, Swenson College of Science and Engineering, University of Minnesota at Duluth. (Gunflint Webcam).
- Matthews, Christopher, Northern Lights Alert, Facebook Group. (Real-time images).
- National Environmental Satellite, Data, and Information Service, National Oceanic and Atmospheric Administration, U.S. Dept. of Commerce. (GOES Image Viewer).
- National Resources Canada, Government of Canada. (CANMOS magnetometer display).
- Nexlab, Meteorology Department, College of DuPage. (CONUS Weather Image).
- North Dakota Dual Aurora Cameras (NoDDAC), a Student Project at the Department of Physics and Astronomy, University of North Dakota, Grand Rapids, North Dakota. (Webcam hosting).
- Northern Lights Alert Facebook Group. (Real-time sighting image gallery).
- Post Observatory, Trenton, MA. (Webcam hosting).
- Shunk Bay Weather.com. (Webcam hosting).
- Spaceweather dot com (Real-time images).
- Spaceweatherlive dot com.
- Space Weather Prediction Center, National Oceanic and Atmospheric Administration, U.S. Department of Commerce. (Aurora oval modeling and Solar wind and CME modeling).
- Starlapland.fi. (Levi Webcam).
- University of Michigan Geosciences. (Geomagnetic sphere models).
- U.S. Forest Service. Boundary Waters Canoe Area Wilderness. (Gunflint webcam hosting).
- U.S. National Park Service, Isle Royale National Park, Michigan. (Webcam hosting).
- U.S. National Park Service, Glacier National Park, Montana. (Webcam hosting).
- University of Reading, British Isles. (Solar wind and CME modelling).
IX. Revision History:
- 2025-12-10. Updated URL to CANMOS stack at Canada.ca. Individual station data is no longer available through Canada.ca.
- 2025-09-17. Added advanced Potsdam GFZ visualizations including 3D Pager model, the GFZ Dynamic Geomagnetic Field Model, and the GFZ Radiation Belt Model.
- 2025-09-17. Added Local Sideral Time automatic clock for Salt Lake City, Utah with option to change observer's location to set find new LST. Added automatic clock to find the Right Ascension facing north from the Local Sideral Time. This is used to determine what constellations should be seen in the background of a north facing webcam.
- 2025-09-17. Added new SWPC displays: (1) SWPC Total Electron Count Scintillation and (2) SWPC Ground Magnetism. Both give near real-time indications of when geomagnetic fields are dipping to and below the United States-Canadian border. Added new SWPC Univ. of Michigan Geospace Magnetosphere model. This display may give indications of intense substorm events. Added express SWPC Real Time Space Wind display tagged with Bt and Bz measurements.
- 2025-09-17. Added new section and reorganized section order. Added Section "Lookup Real Time Sightings." Adds references to real time reporting sites like Aurorasurous based on experience with 9-15 CME-CHS event. Reorganized top levels to create a "Plan for Tonight" section and then moved old top level sections to subsections of "Plan Tonight." This more closely follows actual order of use of items.
- 2025-04-19. Reorganized section orders. Moved "Find Coming CME Waves" from use-order at bottom to logical subject order at top of page. Added "Revision History" section and list.
- 2025-05-25. Canada Natural Resources Department discontinued the CANMOS Summary Magnetometer Plot for budgetary reasons. Individual stations can still be plotted in real time using the updated link.
- 2025-05-25. Temporarily substituted the SpaceweatherLive dot com CANMOS stack display for deprecated Canada NR CANMOS stack.
- 2025-05-25. Added summer season headline observing note.