A visual magnitude chart for field testing for NGC1647, an open cluster in the Taurus constellation, is presented. The purpose of the NGC1647 chart is to provide a study example for estimating limiting magnitudes suitable for large binocular and small telescope users between m_v 6.0 and 13.4. NGC1647 is approximately 45 arcmins in diameter at a distance of 540 pc near Aldebaran at J044608.4 +190437.4.
As of 3/18/2004, the direct view chart has been field tested down to magnitude 11.0 using 20x70 binoculars. Stars unsuitable for low magnification viewing are marked in the supporting catalogue tables in silver. Stars that have not been field tested are marked with blue.
NGC1647 is past its zenith position. By the end of the current dark skies window (approx. 3/25), NGC1647 will be too low off the zenith for star testing; star testing will be deferred until NGC1647 rises in September 2004. If other observers use this chart for the v11.0 to v13.0 magnitude range, I would appreciate receiving any comments or your field notes to expand filed testing further.
The following NGC1647 charts were developed for self-education purposes. Other beginning amateurs may find them useful for developing their skills at estimating star magnitudes using large binoculars and small telescopes. This project also was intended as a personal vehicle to explore how to prepare magnitude charts in the modern era predominated by internet disseminated photoelectric and photographic photometry catalogues. The supporting table include cross-referencing to HD and Tycho2 catalogues and spectral types.
A series of NGC1647 charts and supporting tables can be found at:
http://members.csolutions.net/fisherka/astronote/observed/NGC1647/
That directory contains several direct and reversed views of the same magnitude chart. Each chart is supported by at least two attached tables: one sorted by magnitude and a second by X-Y coordinates. The chart and tables are rendered using XML technology. Therefore, Microsoft Internet Explorer 6.0 or Netscape Navigator 7.0 is required to view these charts and attached tables.
Other suppporting materials include:
For MS-Windows OS users, the following techniques may be helpful for printing the charts and importing catalogues into a spreadsheet.
To have the supporting tables display and print properly, set your brower font size to "smallest" and set margins to the maximum. The chart will resize automatically. Use "Print Preview" to check chart scaling before printing.
If you want to print a raw gif file, right-click on the applicable chart name and save the gif format file on your harddrive. Use MS-PhotoEditor, a standard MS Windows utility, to open and print the file. The Print dialogue within MS-PhotoEditor contains an option to resize the chart to the maximum paper size without distorting the chart scale.
These NGC1647 charts do not plot Johnson V magnitudes; they plot an adjusted visual magnitude that better mimic the response of the human eye in the visual system. Stanton 1999. Once the visual magnitude NGC1647 chart discussed here is field tested, an updated supplemental chart showing the corresponding Johnson V magnitudes also will be produced.
Modern star charts and planetarium programs used by amateur astronomers plot visual magnitudes standardized to the Johnson ubv filter system. Each CCD and major photometry catalogue has its own passband filter, that can be translated into magnitudes in the standard Johnson ubv system. Stanton 1999, Bessel 2000, Ochsenbein 1974.
It has long been known that Johnson V magnitudes do not accurately represent the response of the human eye. Stanton 1999. The human eye perceives fainter and redden stars to a fainter magnitude than the corresponding magnitude in the standard Johnson ubv system.
Although it does not accurately reflect what the human eye sees through binoculars or a telescope, the standard Johnson ubv system is superior for plotting and reporting purposes. Johnson V magnitudes are based on objective, machine reproducible measurements. Photographic and photoelectric photometry have a much lower estimation variance (0.001-0.03) than naked-eye visual estimates (0.10-0.50).
Because Johnson ubv system V magnitudes do not accurately reflect what the human eye sees, especially for fainter magnitudes greater than 9.0v, observers can report a different ordering of the magnitude of stars within a field of view. Both reports – one the Johnson V magnitude on their reference chart and the second based on visual observations – are "right" in the sense that they accurately report what is seen by different measuring instruments ( photoelectric and photographic vs. the human eye). However, the differences can result in reporting differences. Those differences can confuse beginning observers.
This effect can be seen Figure 1 with respect to NGC1647:
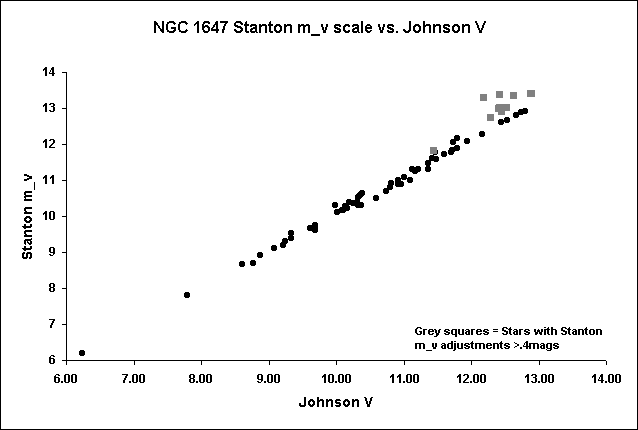
There is good agreement between the standard Johnson V magnitude and the adjusted visual magnitude between v6.0 and v12.2. Beyond v12.2, more reddened faint stars appear in the cluster and the difference between magnitudes seen by a mechanical photometer and the human eye begins to diverge.
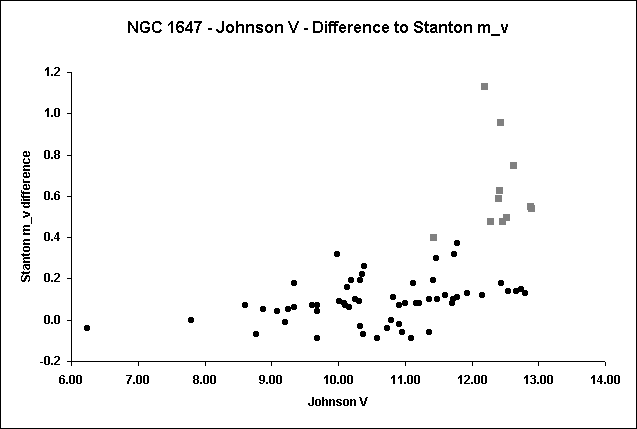
The grey squares in Figures 1 and 2 indicate stars that have differences between their Johnson V and Stanton adjusted magnitudes grater than 0.4 mags. Again, Stanton 1999 adjusts for the ability of the human eye to relatively perceive reddened stars than when stars are "seen" by electro-photographic means through Johnson ubv filters.
In order to study the technique of estimating visual magnitudes through binoculars and small telescopes, magnitude charts and tables were developed for NGC1647 between v6.0 and v13.4. Values plotted on the chart were adjusted to a visual magnitude system from Johnson V magnitudes per Stanton 1999. Supporting tables to the charts list both the Johnson V and adjusted visual magnitude, so users can explore any differences between the systems. It should be noted that modern star charts are not usually plotted in this older visual magnitude system; rather Johnson V magnitude is found and plotted from current photometry catalogues.
Because open cluster NGC147 is 45 arcmins in diameter and has a good selection of stars in a narrow range of color indices, it is a good candidate for developing the skill of estimating magnitudes with binoculars and small telescopes. See Webda online NGC1647 Color Index Chart for color index range of stars in NGC1647 between v6.0 and v14. Unlike its brighter and nearby cousin, the Pleiades, NGC1647 does not have so many bright stars, such that close, faint background stars can be overwhelmed, or a surrounding gaseous nebulae, partially reflective. These factors can effect magnitude estimation.
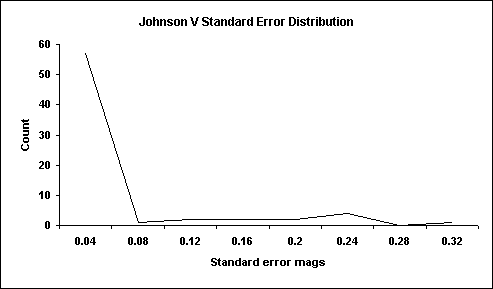
The NGC1647 charts were developed by finding low variance photoelectric and photographic photometry studies in astronomy journals. Turner 1992, Francic 1989. The data in those studies is compiled in the Webda open cluster database. Mermilliod 2004. The star numbering system in the Webda database is based on Cuffey 1937. Standard errors for Johnson B and V magnitudes reported in Turner are v0.01 for photoelectric photometry and v0.03 for photographic photometry. Where necessary to fill-out chart magnitudes between v7.0 to v12.0, low-standard error Tycho-2 photometry records were used, usually with standard errors of 0.03 or less. Tycho-2 photometry was converted into the standard Johnson ubv system using the equations provided in note 7 of the Tycho 2 catalogue. Some higher-variance Tycho-2 stars were added back into the data set to fill-in a tenths of a magnitude sequence.
When plotting visual magnitudes, low-variance photometry is significant. As Stanton 1999 notes, the ability of human observers to estimate visual magnitudes has a error between 0.1 magnitudes for experienced observers and between 0.1 to 0.3 magnitudes for the "average observer". If the underlying photometry has a standard error of 0.2 mags, then all visually observed magnitudes will have an uncertainty of +-0.5 mags.
Photoelectric and photographic photometry from Turner 1992 are already stated in standardized Johnson uvb values. For photometry analysis purposes, all Tycho2 photometry stars were standardized into the Johnson ubv system using the equations in Note 7 from the Tycho2 catalogue with retention of Tycho2 measurement uncertainty.
The resulting catalogue had the following standard errors for Johnson V magnitudes:
Further dataset narrowing was done to remove high color index stars that might exhibit Stanton-type increased magnitudes from star reddening. Even so, some high color index stars had to be included to fill-in the tenths of a magnitude sequence. The distribution of color indices in the catalogue are:
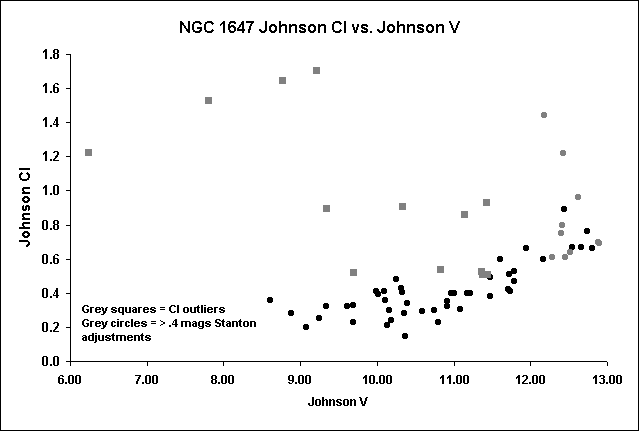
The grey squares in Figure 4 identify stars with high color indices, less than magnitude 11.5. These color index outliers may suffer from magnitude differences between their published Johnson V magnitudes and that preceived by the human eye due to their reddened color. The high color index outliers are:
| Webda_id | X | Y | RA_J2000 | Dec_J2000 | Photometry_type | Johnson_V | Johnson_V_se | Johnson_CI | m_V | m_V_se | m_V_Diff |
| 0001 | 1.21 | -12.37 | 4 46 16.8 | +18 44 04.8 | Tycho2 | 6.24 | 0.03 | 1.22 | 6.20 | 0.20 | -0.04 |
| 0002 | -0.43 | -10.03 | 4 46 05.1 | +18 48 02.6 | Tycho2 | 7.8 | 0.04 | 1.53 | 7.80 | 0.20 | 0.00 |
| 0105 | 3.85 | 15.17 | 4 46 35.9 | +19 29 38.5 | Tycho2 | 8.77 | 0.06 | 1.65 | 8.70 | 0.20 | -0.07 |
| 0084 | 13.41 | 8.85 | 4 47 42.8 | +19 19 07.9 | Tycho2 | 9.21 | 0.09 | 1.71 | 9.20 | 0.20 | -0.01 |
| 0016 | -5.93 | 9.94 | 4 45 27.6 | +19 20 57.2 | Turner photoelectric | 9.34 | 0.01 | 0.90 | 9.52 | 0.24 | 0.18 |
| 0065 | -13.05 | -2.45 | 4 44 37.2 | +19 00 34.6 | Tycho2 | 9.69 | 0.09 | 0.52 | 9.60 | 0.20 | -0.09 |
| 0039 | 0.67 | -0.18 | 4 46 13.1 | +19 04 18.0 | Turner photoelectric | 10.33 | 0.01 | 0.91 | 10.52 | 0.24 | 0.19 |
| 0013 | -4.47 | 5.92 | 4 45 37.3 | +19 14 25.5 | Turner photoelectric | 10.82 | 0.01 | 0.54 | 10.93 | 0.24 | 0.11 |
| 0040 | 0 | 0 | 4 46 08.4 | +19 04 37.4 | Turner photoelectric | 11.13 | 0.01 | 0.86 | 11.31 | 0.24 | 0.18 |
| 0078 | 9.32 | -10.83 | 4 47 13.1 | +18 46 38.9 | Tycho2 | 11.36 | 0.32 | 0.53 | 11.30 | 0.50 | -0.06 |
| 0028 | 3.6 | 1.62 | 4 46 33.7 | +19 07 15.6 | Turner photoelectric | 11.37 | 0.01 | 0.51 | 11.47 | 0.24 | 0.10 |
| 0052 | -7.31 | 2.1 | 4 45 17.3 | +19 08 06.9 | Turner photoelectric | 11.42 | 0.01 | 0.93 | 11.61 | 0.24 | 0.19 |
| 0014 | -2.93 | 5.8 | 4 45 48.1 | +19 14 12.8 | Turner photographic | 11.43 | 0.01 | 0.51 | 11.83 | 0.27 | 0.40 |
Stars with low variance photometry were then converted from the Johnson V magnitudes to an estimated visual magnitude using Equation 14 from Stanton 1999:
m_v = V + 0.210(B-V) Equation 1.0
Stars whose photometry source was Tycho2 were converted directly from the Tycho2 V magnitudes to an estimated visual magnitude using Equation 15 from Stanton 1999:
m_v = V_t + 0.089(B_t-V_t) Equation 2.0
Johnson V and Stanton adjusted m_v magnitudes agree until fainter-redder stars beyond magnitude 11.5 are observered. See Figures 1 and 2 (grey squares), Figure 4 (grey circles) and Figure 5. This is an expected result of Equation 1.0.
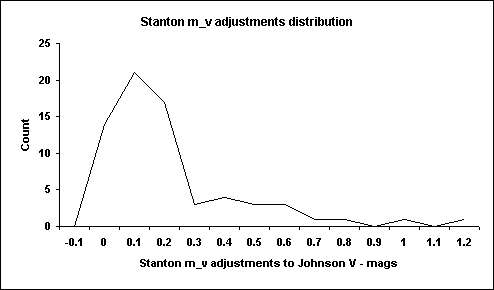
The grey circles in Figure 4 identify stars with significantly Stanton adjusted magnitudes. Generally, these are stars that are 1) faint, 2) have a high color index and 3) were measured by photography, not by photoelectric means. These stars are not outliers, but stars whose magnitudes are intentionally adjusted to better reflect the response of the human eye.
| Webda_id | X | Y | RA_J2000 | Dec_J2000 | Photometry_type | Johnson_V | Johnson_V_se | Johnson_CI | m_V | m_V_se | m_V_Diff |
| 0014 | -2.93 | 5.8 | 4 45 48.1 | +19 14 12.8 | Turner photographic | 11.43 | 0.01 | 0.51 | 11.83 | 0.27 | 0.40 |
| 0038 | -0.43 | -0.65 | 4 46 05.4 | +19 03 32.6 | Turner photographic | 12.28 | 0.01 | 0.61 | 12.76 | 0.27 | 0.48 |
| 0210 | -1.29 | 0.27 | 4 45 59.4 | +19 05 05.0 | Turner photographic | 12.45 | 0.01 | 0.61 | 12.93 | 0.27 | 0.48 |
| 0008 | -5.33 | 0.75 | 4 45 31.1 | +19 05 52.9 | Turner photographic | 12.52 | 0.01 | 0.64 | 13.02 | 0.27 | 0.50 |
| 0032 | 3.79 | -2.87 | 4 46 34.7 | +18 59 49.5 | Turner photographic | 12.89 | 0.01 | 0.69 | 13.43 | 0.27 | 0.54 |
| 0177 | 3.67 | -3.43 | 4 46 34.0 | +18 58 54.6 | Turner photographic | 12.88 | 0.01 | 0.70 | 13.43 | 0.27 | 0.55 |
| 0047 | -2.41 | 1.7 | 4 45 51.6 | +19 07 25.5 | Turner photographic | 12.4 | 0.01 | 0.75 | 12.99 | 0.27 | 0.59 |
| 0007 | -3.57 | -0.16 | 4 45 43.4 | +19 04 20.1 | Turner photographic | 12.41 | 0.01 | 0.80 | 13.04 | 0.27 | 0.63 |
| 0036 | -0.29 | -3.97 | 4 46 06.2 | +18 58 02.5 | Turner photographic | 12.62 | 0.01 | 0.96 | 13.37 | 0.27 | 0.75 |
| 0092 | 3.18 | 4.25 | 4 46 30.8 | +19 11 36.8 | Turner photographic | 12.42 | 0.01 | 1.22 | 13.38 | 0.27 | 0.96 |
| 0006 | -5.05 | -2.75 | 4 45 32.9 | +19 00 04.8 | Turner photographic | 12.18 | 0.01 | 1.44 | 13.31 | 0.27 | 1.13 |
The data gathering and selection process is documented in the Star numbering system supporting catalogue (22kb):
Catalogue as importable text file
which includes cross-referencing to HD and Tycho2 catalogue star identifications, and in the supplemental worksheet supporting charts, in Excel 2000 format (763kb):
http://members.csolutions.net/fisherka/astronote/observed/NGC1647/NGC1647_XY_Chart_Plot.xls
Approximately 69 stars between v6.0 and v13.4 with low variance photometry were then plotted on each NGC1647 chart using a closed circle and was labeled with a magnitude.
Not all stars are within NGC1647 are plotted or labeled with a magnitude. NGC1647 consists of approximately 350 stars. Other stars with a Johnson V lower than 13.4 are also plotted (N=36), but these stars have less-reliable and higher-standard-error photometry. The uncertainty associated with their photometry measurement precludes using these stars for magnitude plotting and estimation. But in order to provide a better spatial visual reference for the observer, these stars are plotted using their raw Johnson V magnitude, but with an open circle that is not labeled with a magnitude.
The next step in this chart development process is to field test the NGC1647 chart, primarily to see if order of magnitudes for low-variance photometry stars accurately reflects the magnitude order of stars as seen through the eyepiece.
The supporting star tables also report an uncertainty variance for each magnitude in the visual system. For discussion purposes, this is reported as a two-decimal number. As Stanton 1999 notes, the ability of human observers to estimate visual magnitudes has a error between 0.1 magnitudes for experienced observers and between 0.1 to 0.3 magnitudes for the "average observer".
An inherent 0.2 magnitude uncertainty is adopted on the NGC1647 chart when the Johnson V magnitude is transformed from to the visual magnitude system. The second precision digit (e.g. 0.24) generally reflects uncertainty contributed by the error in the low variance photoelectric or photographic estimation of Johnson V.
Even with these star population filters to assure low-photometry variance and low-color indices, ocassionally the plotted magnitudes may not accurately reflect what is seen by the human eye through the telescope. Reasons for plotting failures (in the sense that the chart does not accurately reflect the order of magnitudes seen through a telescope or binoculars) can include:
One initial tester of this chart, using the chart in urban light polluted stars and off-zenith, reports that although the order of the magnitudes appeared correct through a limiting magnitude of about v10.0, two sets of stars with divergent chart plots appeared to be of equal brightness. Stars 094 (Stanton v9.7) and 099 (corrected Stanton v10.2) appeared to be of equal brightness. Stars 065 (Stanton plotted v9.6) and 066 (Stanton plotted v10.3) also appeared to be of equal brightness. Stars 065 (CI 0.52), 066 (CI 0.40) and 099 (0.41) have relatively higher Johnson color indices than the rest of the catalogue stars. See Figure 4. Confirming observations in better skies and closer to the zenith are still in process (as of 3/2004).
Stars on the NGC1647 charts that might be suitable for exploring the effect of reddening on visual magnitude would have the same Johnson V magnitude but divergent Johnson color indices. Some suggested star pairs are:
A magnitude chart to below magnitude 15.0 was published by R.N. Clark in Appendix D of his 1990 classic Visual Astronomy of the Deep Sky. Clark's chart was based on Hoag's 1960 photoelectric data. Hoag's data has been superceded by Stanton (1989), Turner (1992) and to some extent, Tycho-2. Clark's NGC1647 chart does go to lower magnitudes than the chart presented here.
The Webda online database contains two magnitude and chart numbering charts for NGC1647 prepared in 1900 and the 1970s. Stars are labeled with star numbering system ids, but not magnitudes. NGC1647 appears in the corner of AAVSO chart V Tauri 0446+17 (b), but since there is no prominent variable within the cluster, magnitudes are not estimated. http://www.aavso.org/ NGC1647 is located within International Meteor Organization visual limiting magnitude estimation area 8. http://www.imo.net/visual/lm.html.
In addition to the modern era investigations of NGC1647 (Turner 1992; Francic 1989), Hertzsprung used the 60-inch Mt. Wilson reflector stopped down to 40 inches with a diffraction grating made from rubber cords to examine NGC 1647 as part of his early studies of the color index. Hertzsprung 1915; Seares 1915. Although he was using the most advanced telescope of his day, technology was such that Hertzsprung could only estimate magnitudes with an accuracy of v0.10.
More recent studies have focused on whether nearby variable SZ Tauri, a classical Cephid located about 2 degrees east of NGC1647, is a member of cluster NGC1647. See the NGC1647 area finder chart. Turner 1992 concluded SZ Tauri is a member of NGC1647 based on photometry. Geffert 1996 concluded SZ Tauri is not a member of NGC1647 based on astrometry (proper motion).
Cantrell presented a new photometry study for NGC1647 at the January 2004 meeting of the American Astronomical Society, but the study has not yet been published in available journals.
Again, I would appreciate it if observers in other locations might take a few minutes to field test this chart while it is still near the zenith, time permitting within your observing sessions.
This is an amateur observer effort. All criticisms and correction of any errors are solicited and welcomed.
Please provide any comments via usenet or via email to:
Kurt Fisher fisherka@csolutions.net 2/2004
This note makes use of data from:
Webda Online Database of Open Clusters, a project of Jean-Claude Mermilliod obswww.unige.ch/webda/
Simbad Online Database, a project of the Centre de Données astronomiques de Strasbourg de l'Université Louis Pasteur et du CNRS http://simbad.u-strasbg.fr/sim-fid.pl
Bessell, M. July, 2000. The Hipparcos and Tycho Photometric System Passbands. PASP 112:961 NASA ADS
Cantrell, K.A. et al. January 2004. Study of NGC 1647 in the u'g'r'i'z' filter system. Session 14.09, AAS 203rd meeting (abstract) NASA ADS
Appendix D in Clark, R.N. 1990. Visual Astronomy of the Deep Sky, Cambridge University Press and Sky Publishing, Cambridge. VSDS
Cantrell, K.A. et al. 2003. Study of NGC 1647 in the u'g'r'i'z' Filter System. American Astronomical Society Meeting 203, #14.09 NASA ADS
Francic, Stephen P. 1989. Mass functions for eight nearby galactic clusters. Astron.J. 98(3):888 (photographic in Johnson ubv) NASA ADS
Geffert, M. et al. 1996. The astrometric accuracy of "Carte du Ciel" plates and proper motions in the field of the open cluster NGC1647. Astron. Ap. Suppl. Serv. 118:277 NASA ADS
Hertzsprung, E. 1915. Effective wavelengths of 184 stars in the cluster N.G.C. 1647. ApJ 42:92H NASA ADS
Johnson, H.L. and Morgan, W.W. 1953. Astrophysics.J. 117:313 (Johnson ubv system seminal paper) NASA ADS
Mermilliod, Jean-Claude. 2004. Webda: A Site Devoted to Star Clusters. Online database. << http://obswww.unige.ch/webda/ accessed 2/2004 >> (See Webda online NGC1647 Color Index Chart for color index range of stars in NGC1647 between v6.0 and v14)
Ochsenbein, F. 1974. On the relationship between the apparent magnitudes given in several catalogues and the ubv system. Astron. Astophys. Suppl. 15:215 NASA ADS
Schlosser, W., Schmidt-Kaler, T., Milone, E.F. 1991. Challenges of Astronomy. Springer-Verlag. Section 19.5 at pp. 102.
Seares, F. H. 1915. Color-indices in the cluster N.G.C. 1647. ApJ 42:120S NASA ADS
Stanton, Richard H. 1999. Visual magnitudes and the "average observer": The SS Cygni field experiment. JAAVSO 27:97 NASA ADS
Turner, David G. 1992. Galactic clusters with associated Cepheid variables III. NGC 1647 and SZ Tauri. Astron.J. 104(5):1865 (photoelectric and photographic in Johnson ubv with average se of 0.03 for photoelectric and 0.01 for photographic) NASA ADS
UNSO. 2004. Catalogue Information and Recommendations. Web page. http://ad.usno.navy.mil/star/star_cats_rec.shtml
Brian Skiff. 4/2/1996. Star magnitudes, catalogues, etc.
Bill Ferris. 2/15/2002. 18:34:55 PST. UNSO-A2.0 vs. GSC